What half-life means for a weekly shot
A medicine’s half-life is the time it takes for the amount in your blood to fall by half. After one half-life, half is left. After two, a quarter. After about five, very little remains.
The long-acting GLP-1 medicines were designed to last. The US prescribing information gives these approximate half-lives:
| Medicine | Brand examples | Half-life (US label) | How often it’s taken |
|---|---|---|---|
| Semaglutide | Ozempic, Wegovy | About 1 week | Once a week |
| Tirzepatide | Mounjaro, Zepbound | About 5 days | Once a week |
| Dulaglutide | Trulicity | About 5 days | Once a week |
| Liraglutide | Victoza, Saxenda | About 13 hours | Once a day |
Sources: section 12.3 of the Ozempic, Mounjaro, Trulicity and Victoza prescribing information.
A long half-life is why a weekly shot works: by the time the next dose is due, a good part of the last one is still there. It’s also why levels build up over the first weeks. The labels say semaglutide reaches a steady level after 4 to 5 weeks of weekly doses and tirzepatide after about 4 weeks. And it’s why the medicine lingers after you stop: the Wegovy label says semaglutide stays in the body for about 5 to 7 weeks after the last dose.
Counting down a single dose
Half-lives stack up in a predictable way. This is plain arithmetic from the label half-lives, for one dose with no new shot after it:
| Half-lives passed | Share of the dose left | Tirzepatide (about 5 days each) | Semaglutide (about 7 days each) |
|---|---|---|---|
| 1 | About 50% | Day 5 | Day 7 |
| 2 | About 25% | Day 10 | Day 14 |
| 3 | About 12.5% | Day 15 | Day 21 |
| 4 | About 6% | Day 20 | Day 28 |
| 5 | About 3% | Day 25 | Day 35 |
That lines up with what the manufacturers say. Lilly’s medical information team puts tirzepatide’s clearance at about 30 days after the last dose, and the Wegovy label gives 5 to 7 weeks for semaglutide. The table is a simplification: on weekly doses, each new shot lands on top of what’s left from the last ones, which is the build-up Mingo’s chart draws.
Knowing this matters in a few real situations: a surgery or procedure where your care team asks when you last took your shot, a pregnancy plan, or a break in treatment. In each case, the decision belongs to your prescriber, and a log with exact dates makes their job easier.
How Mingo turns your doses into a curve
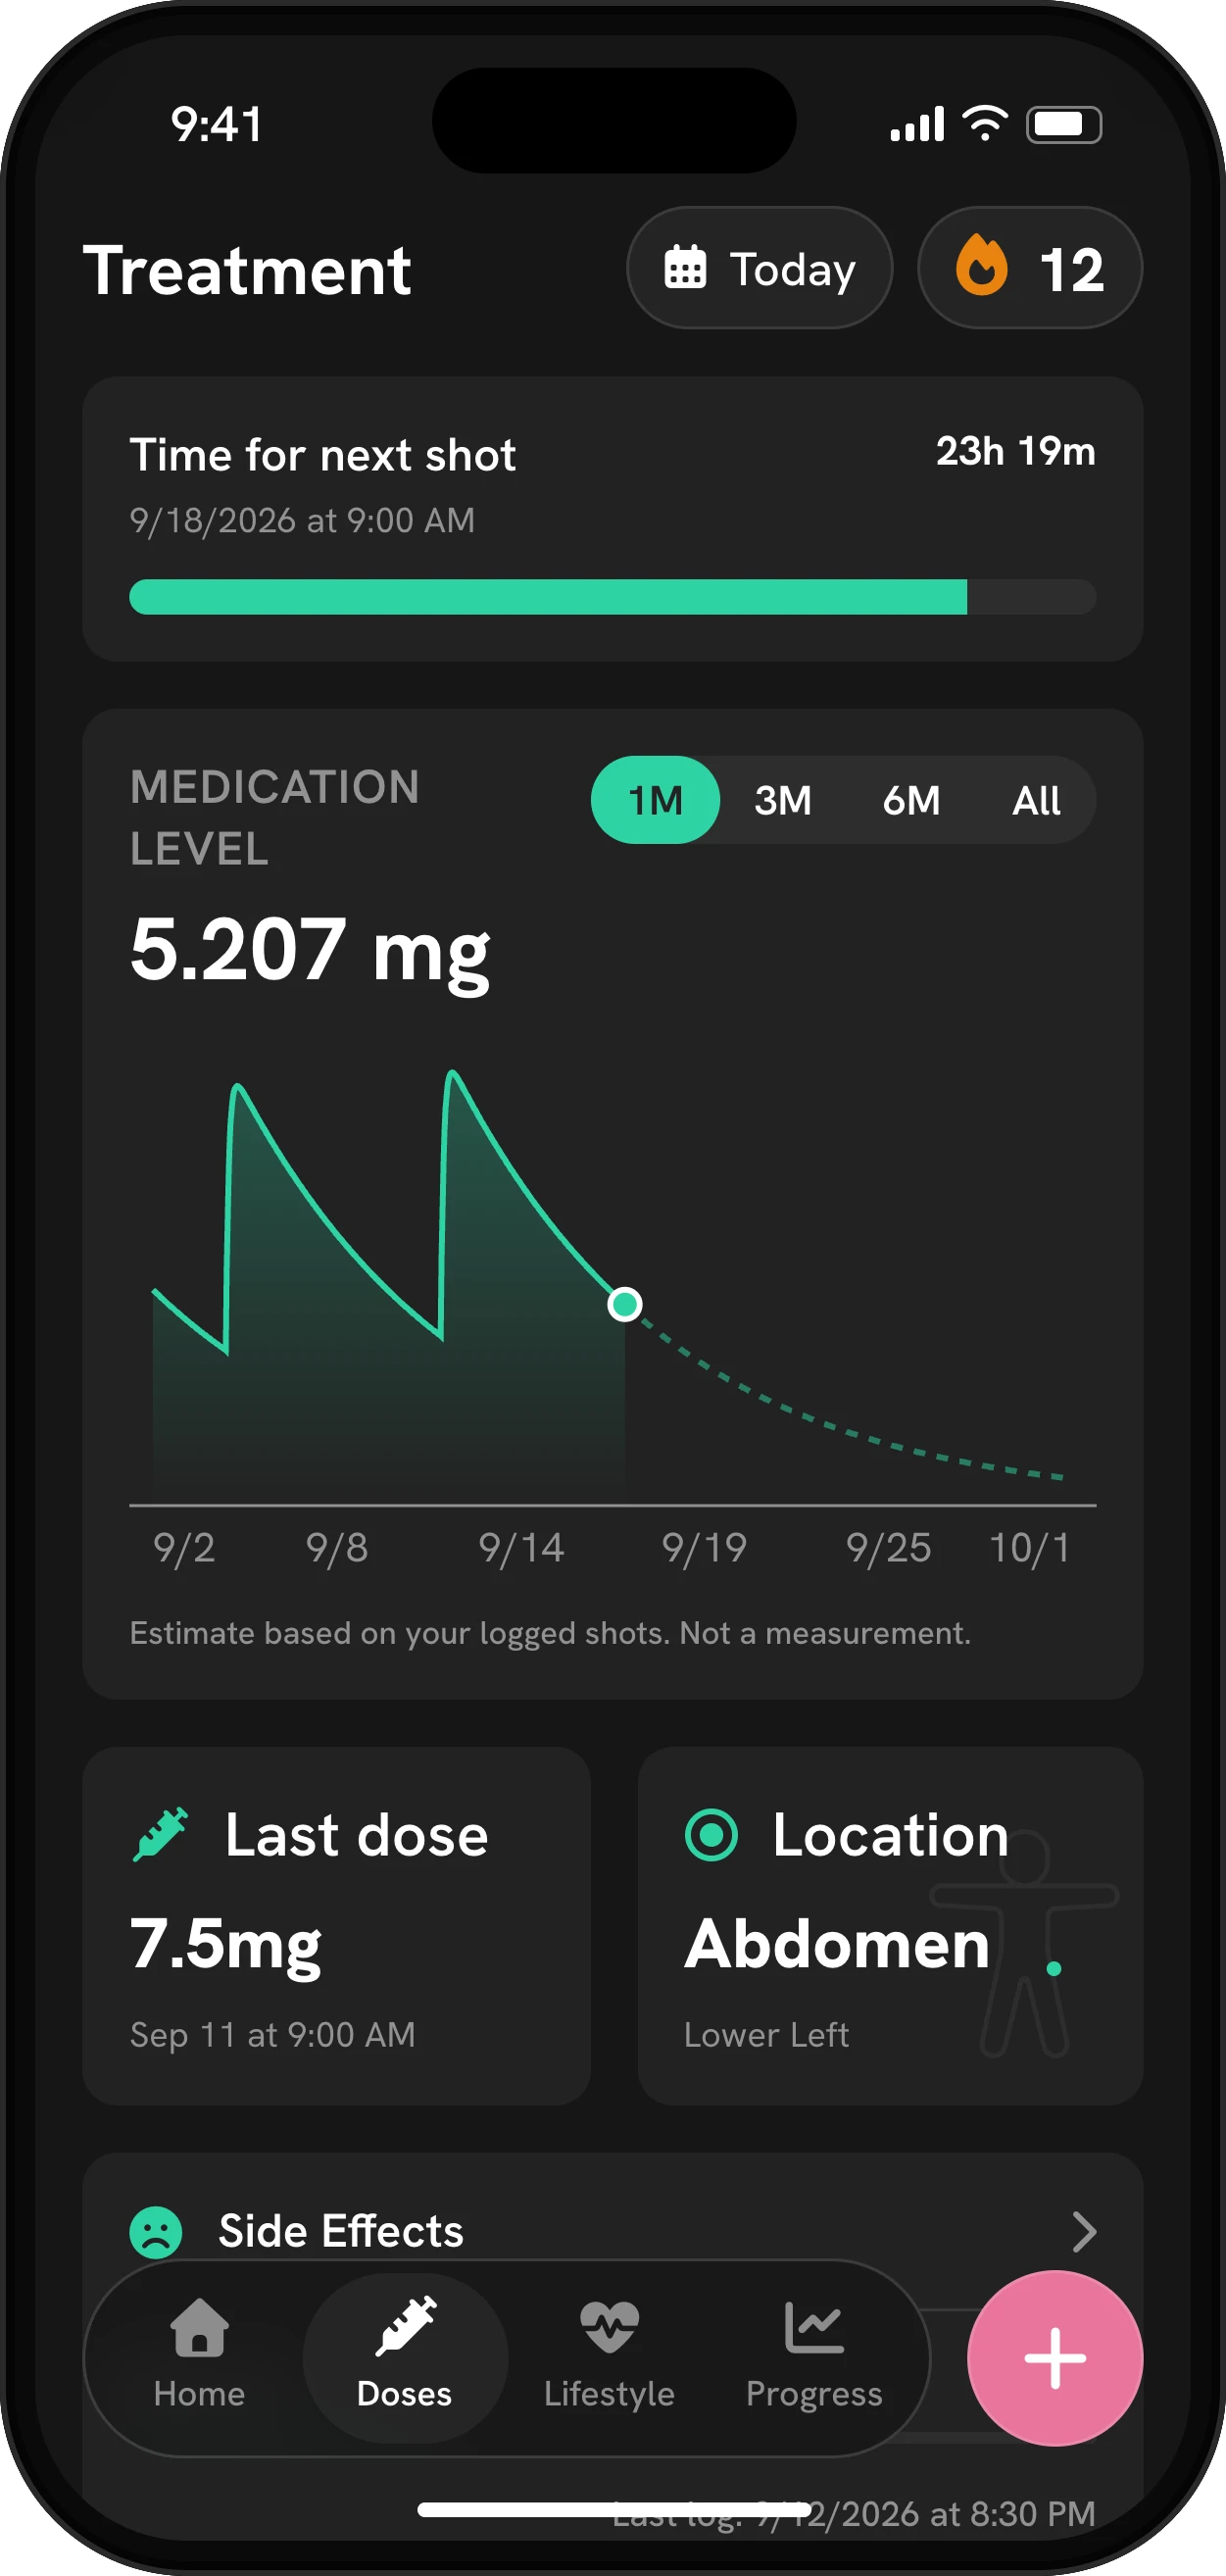
Most half-life calculators online ask you to type in a dose and a schedule, then draw an ideal week. Mingo works from what you actually took. Every dose you log becomes its own small curve: it rises as the medicine is absorbed, peaks, then falls at the rate set by the half-life. The chart adds all of those curves together. If you took a shot a day late, or stepped up from 0.5 to 1 mg in March, the chart shows exactly that.
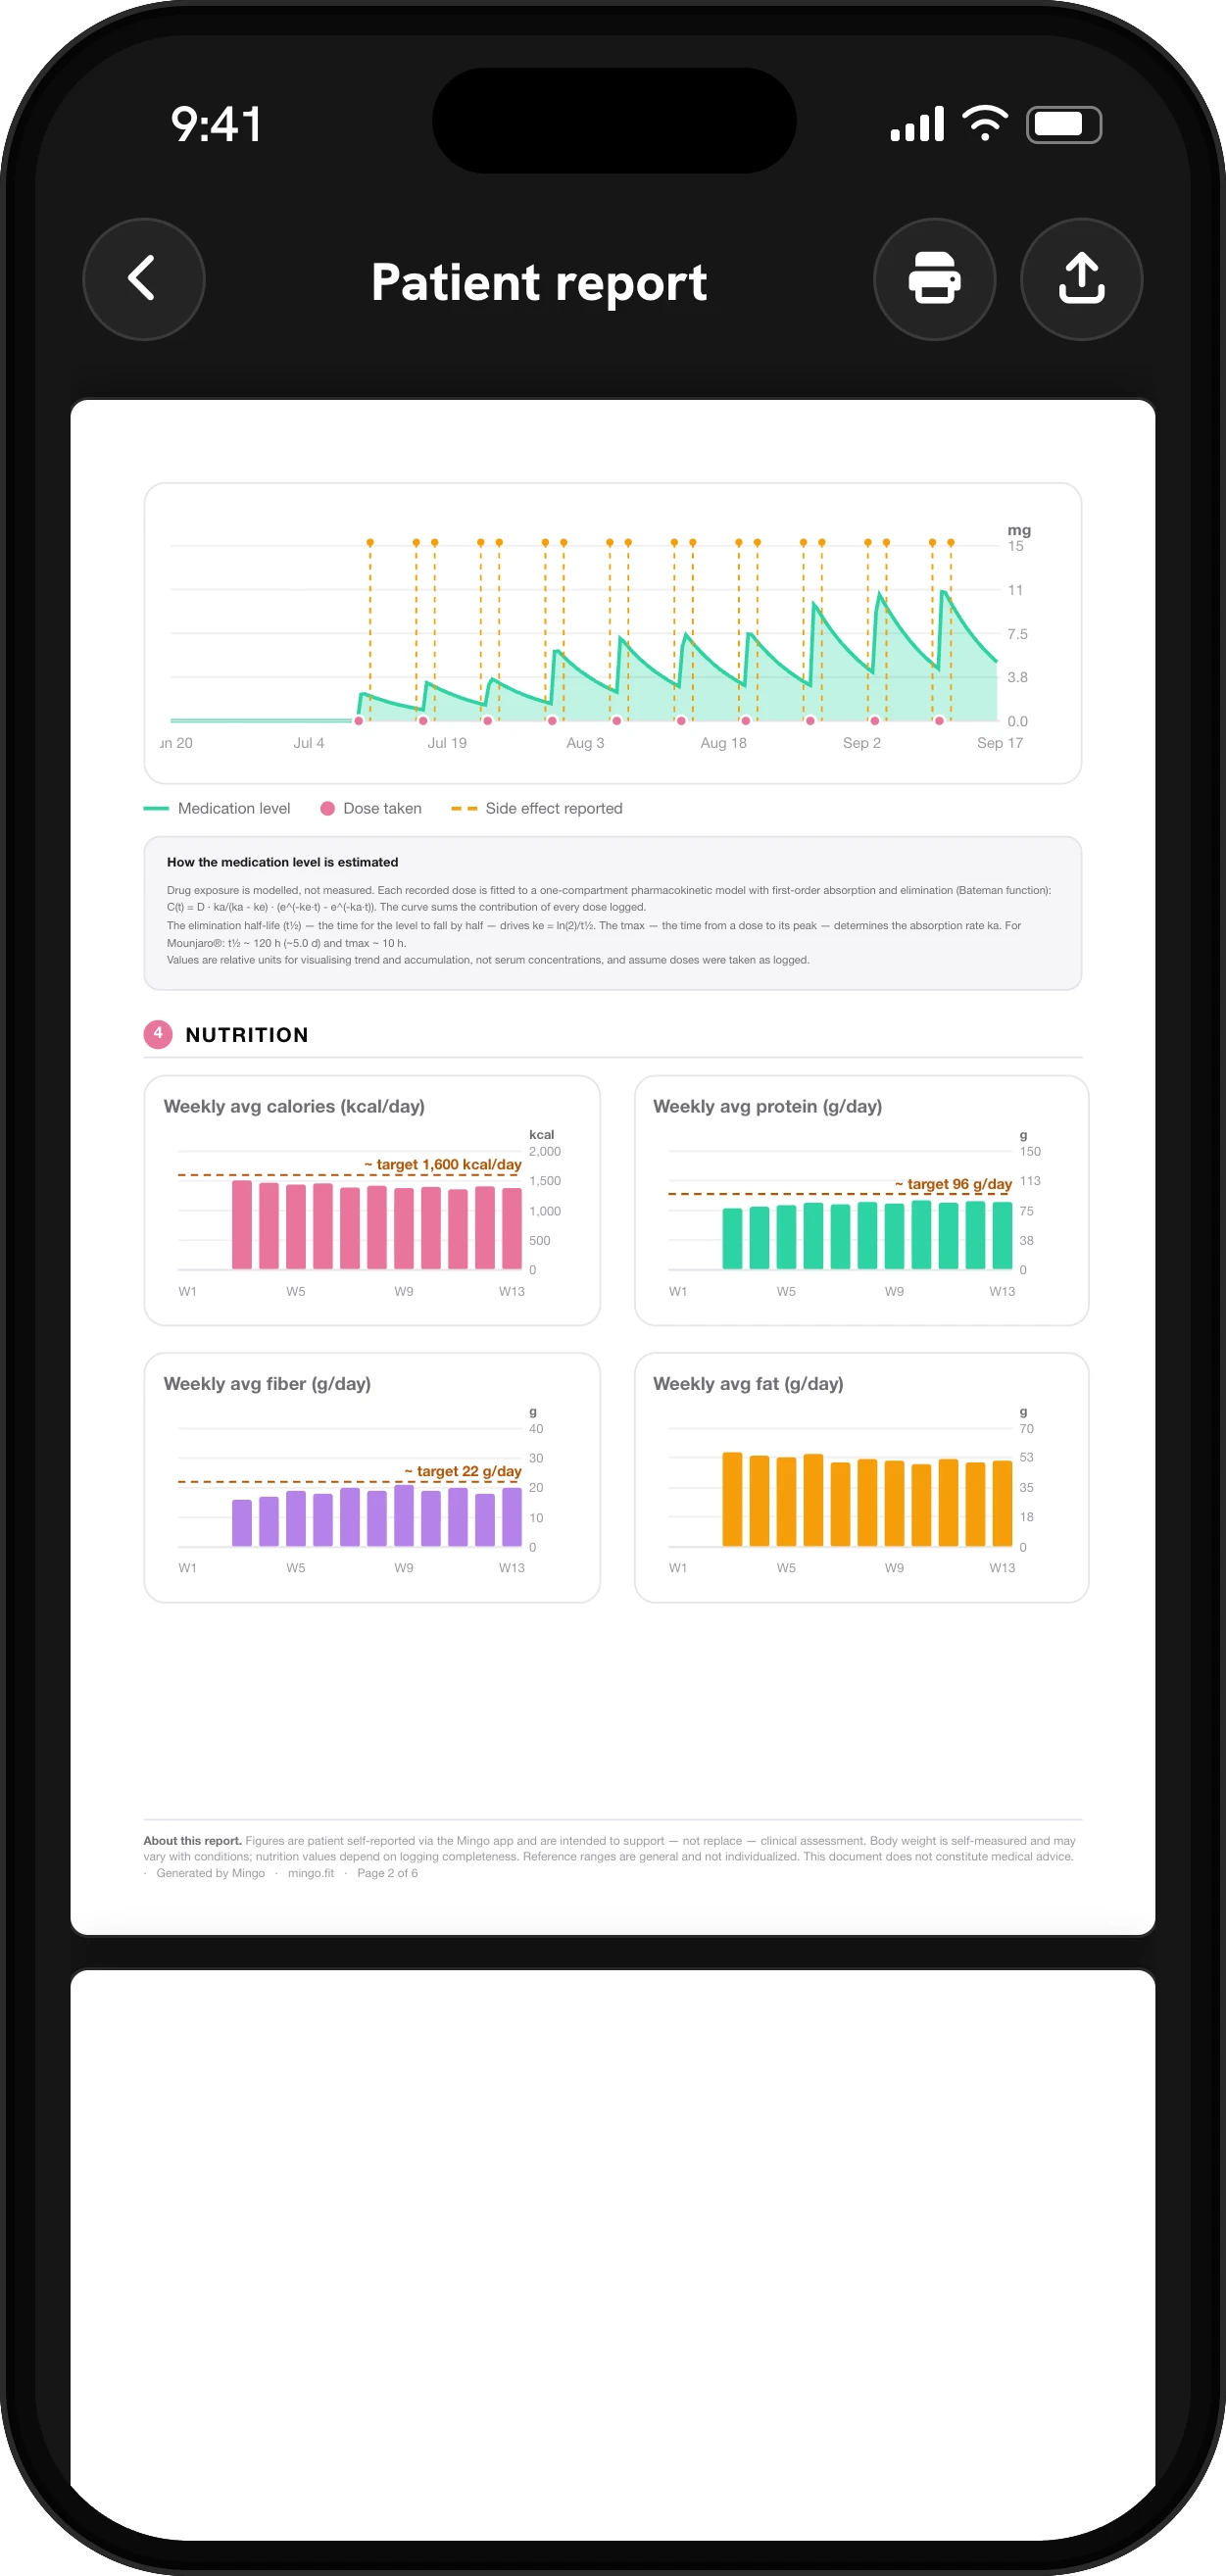
Under the hood, it’s a standard one-compartment pharmacokinetic model with first-order absorption and elimination. The half-life sets how fast the level falls, and a published time-to-peak sets how fast it rises. The PDF report for your doctor spells out the formula and the values used for your medicine, so nothing is hidden.
The result is labeled in mg so the trend is easy to read, but it’s a relative scale, not your blood concentration, and Mingo says so under every chart: estimate based on your logged shots, not a measurement.
Where you’ll see it
- Home screen: a card with your current estimate and the week’s curve.
- Treatment tab: the full chart, with ranges of one, three or six months, or your whole history.
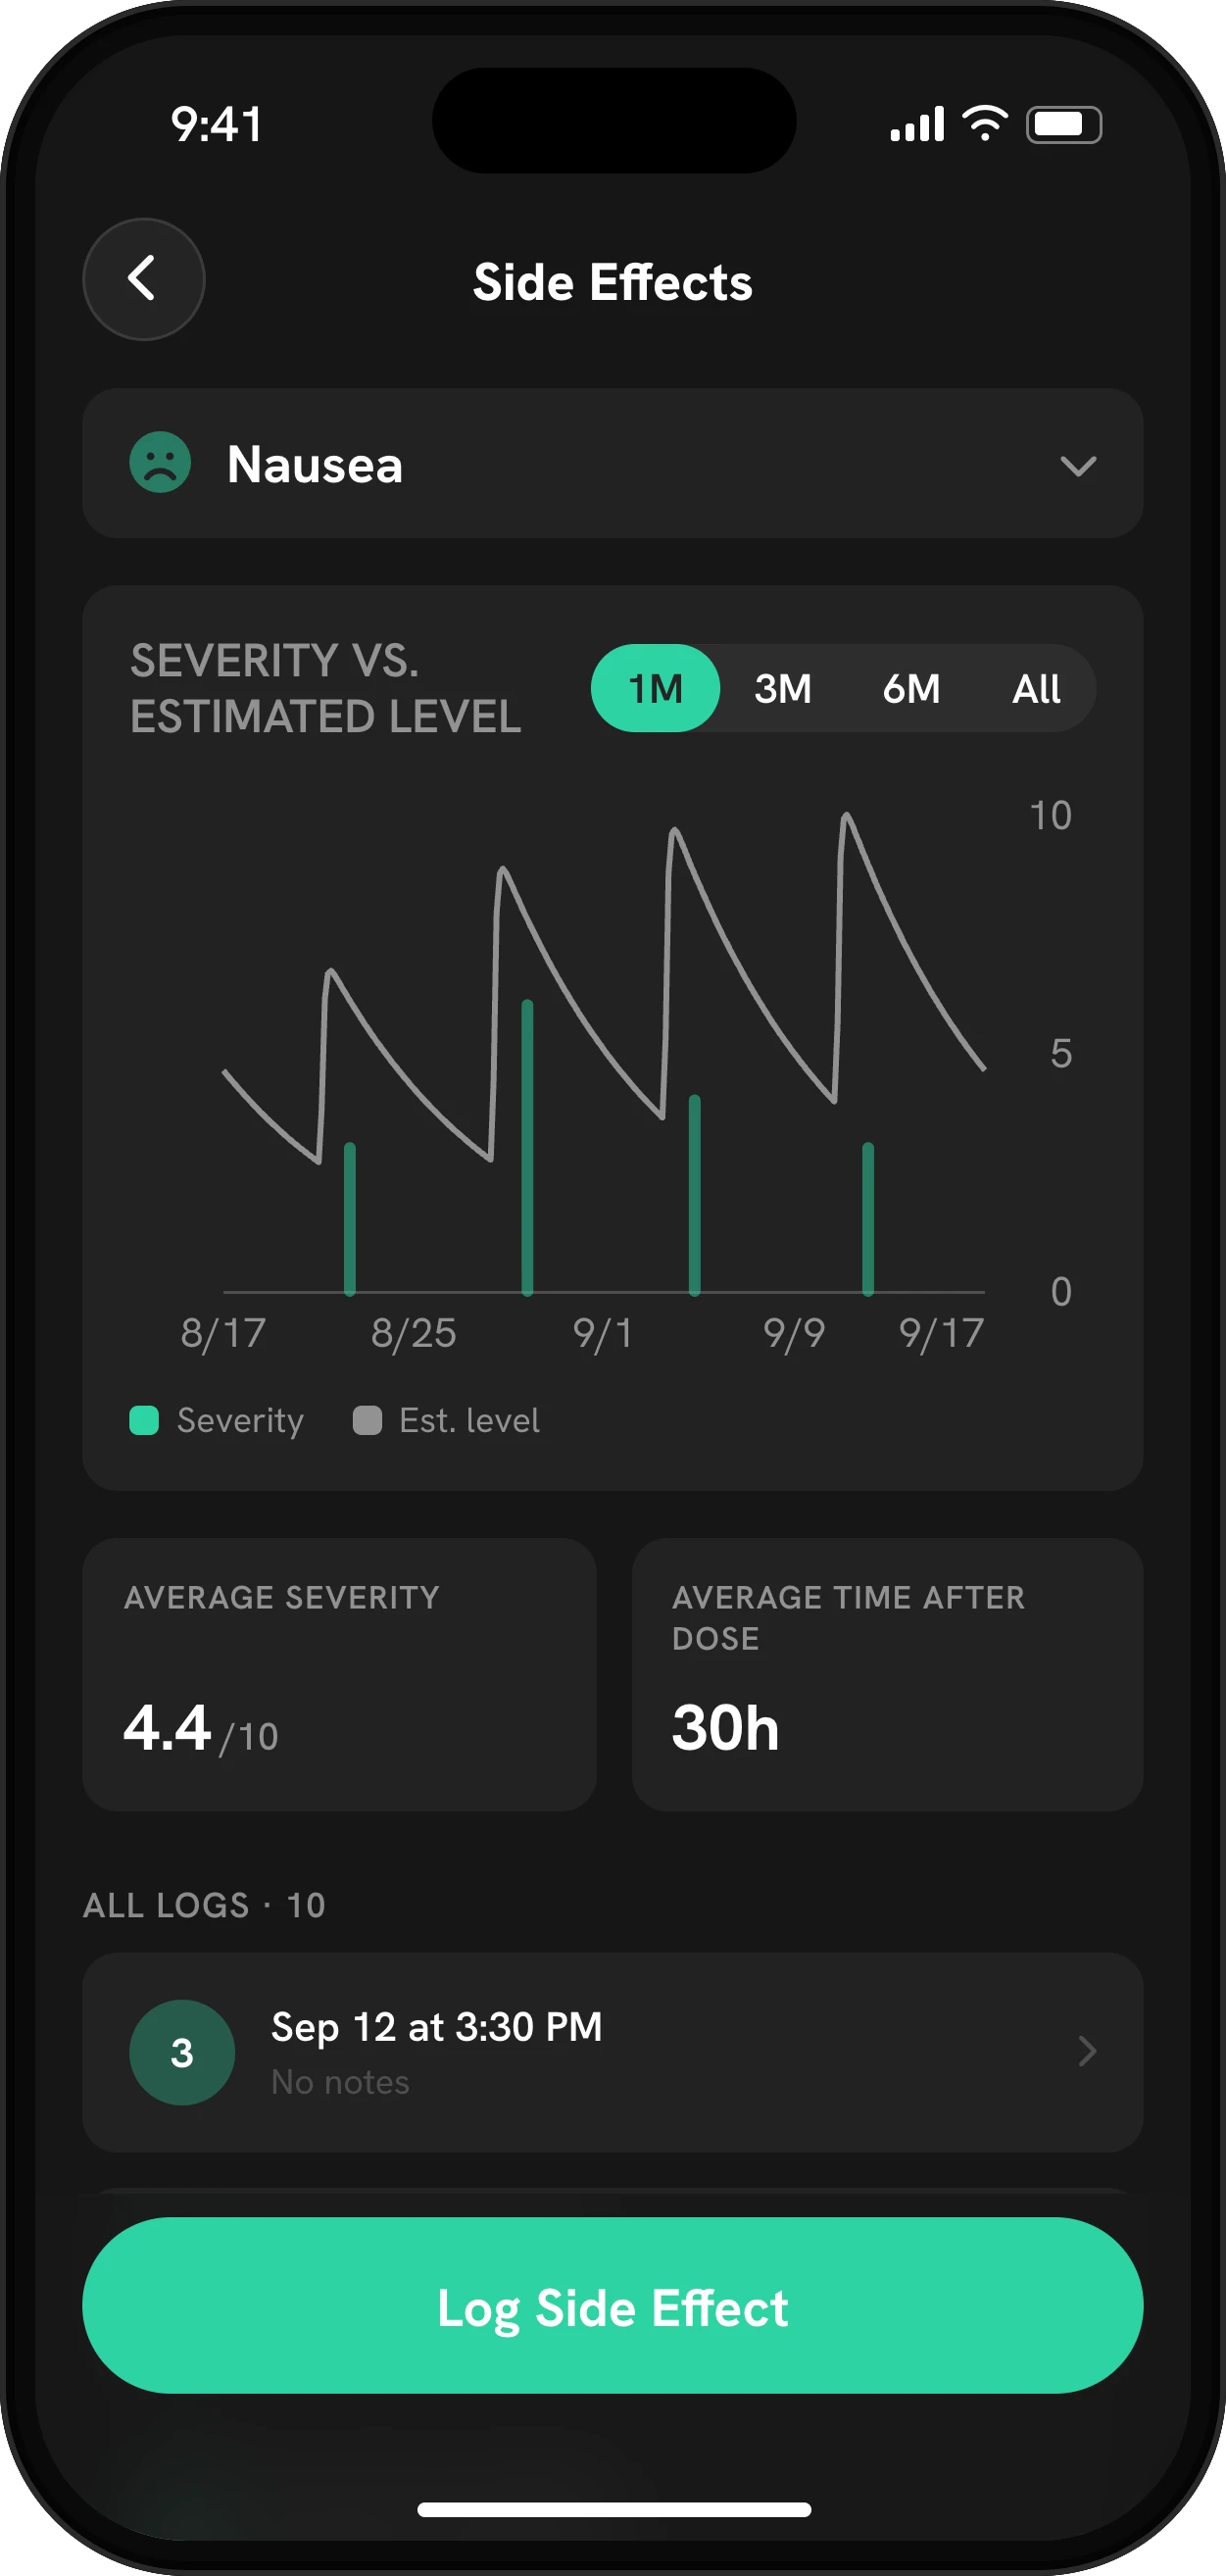
- Side effects: each symptom’s chart shows severity against your estimated level, which can make a pattern like “nausea the day after a shot” easy to spot.
- Doctor report: the curve with each dose marked and side effects shown as dashed lines.
What it can and can’t tell you
The curve is good at showing shape and timing. It can show that your level dips toward the end of the week, that a missed dose left a gap, or that a dose step raised the whole curve. Many people find it helps explain why appetite or side effects shift across the week.
It can’t tell you your exact level, whether the dose is right for you, or when to take your next shot. Bodies differ, and the published half-life is an average from clinical studies. Use it as a conversation starter with your prescriber, not a reason to change anything on your own.
Related tools
The timeline calculator shows what to expect week by week on your medicine, and the missed dose calculator applies your label’s rule if a dose slips. The same half-life model also powers the best day for your shot suggestion. Back to the GLP-1 shot tracker.


