Why weight on a GLP-1 needs a different chart
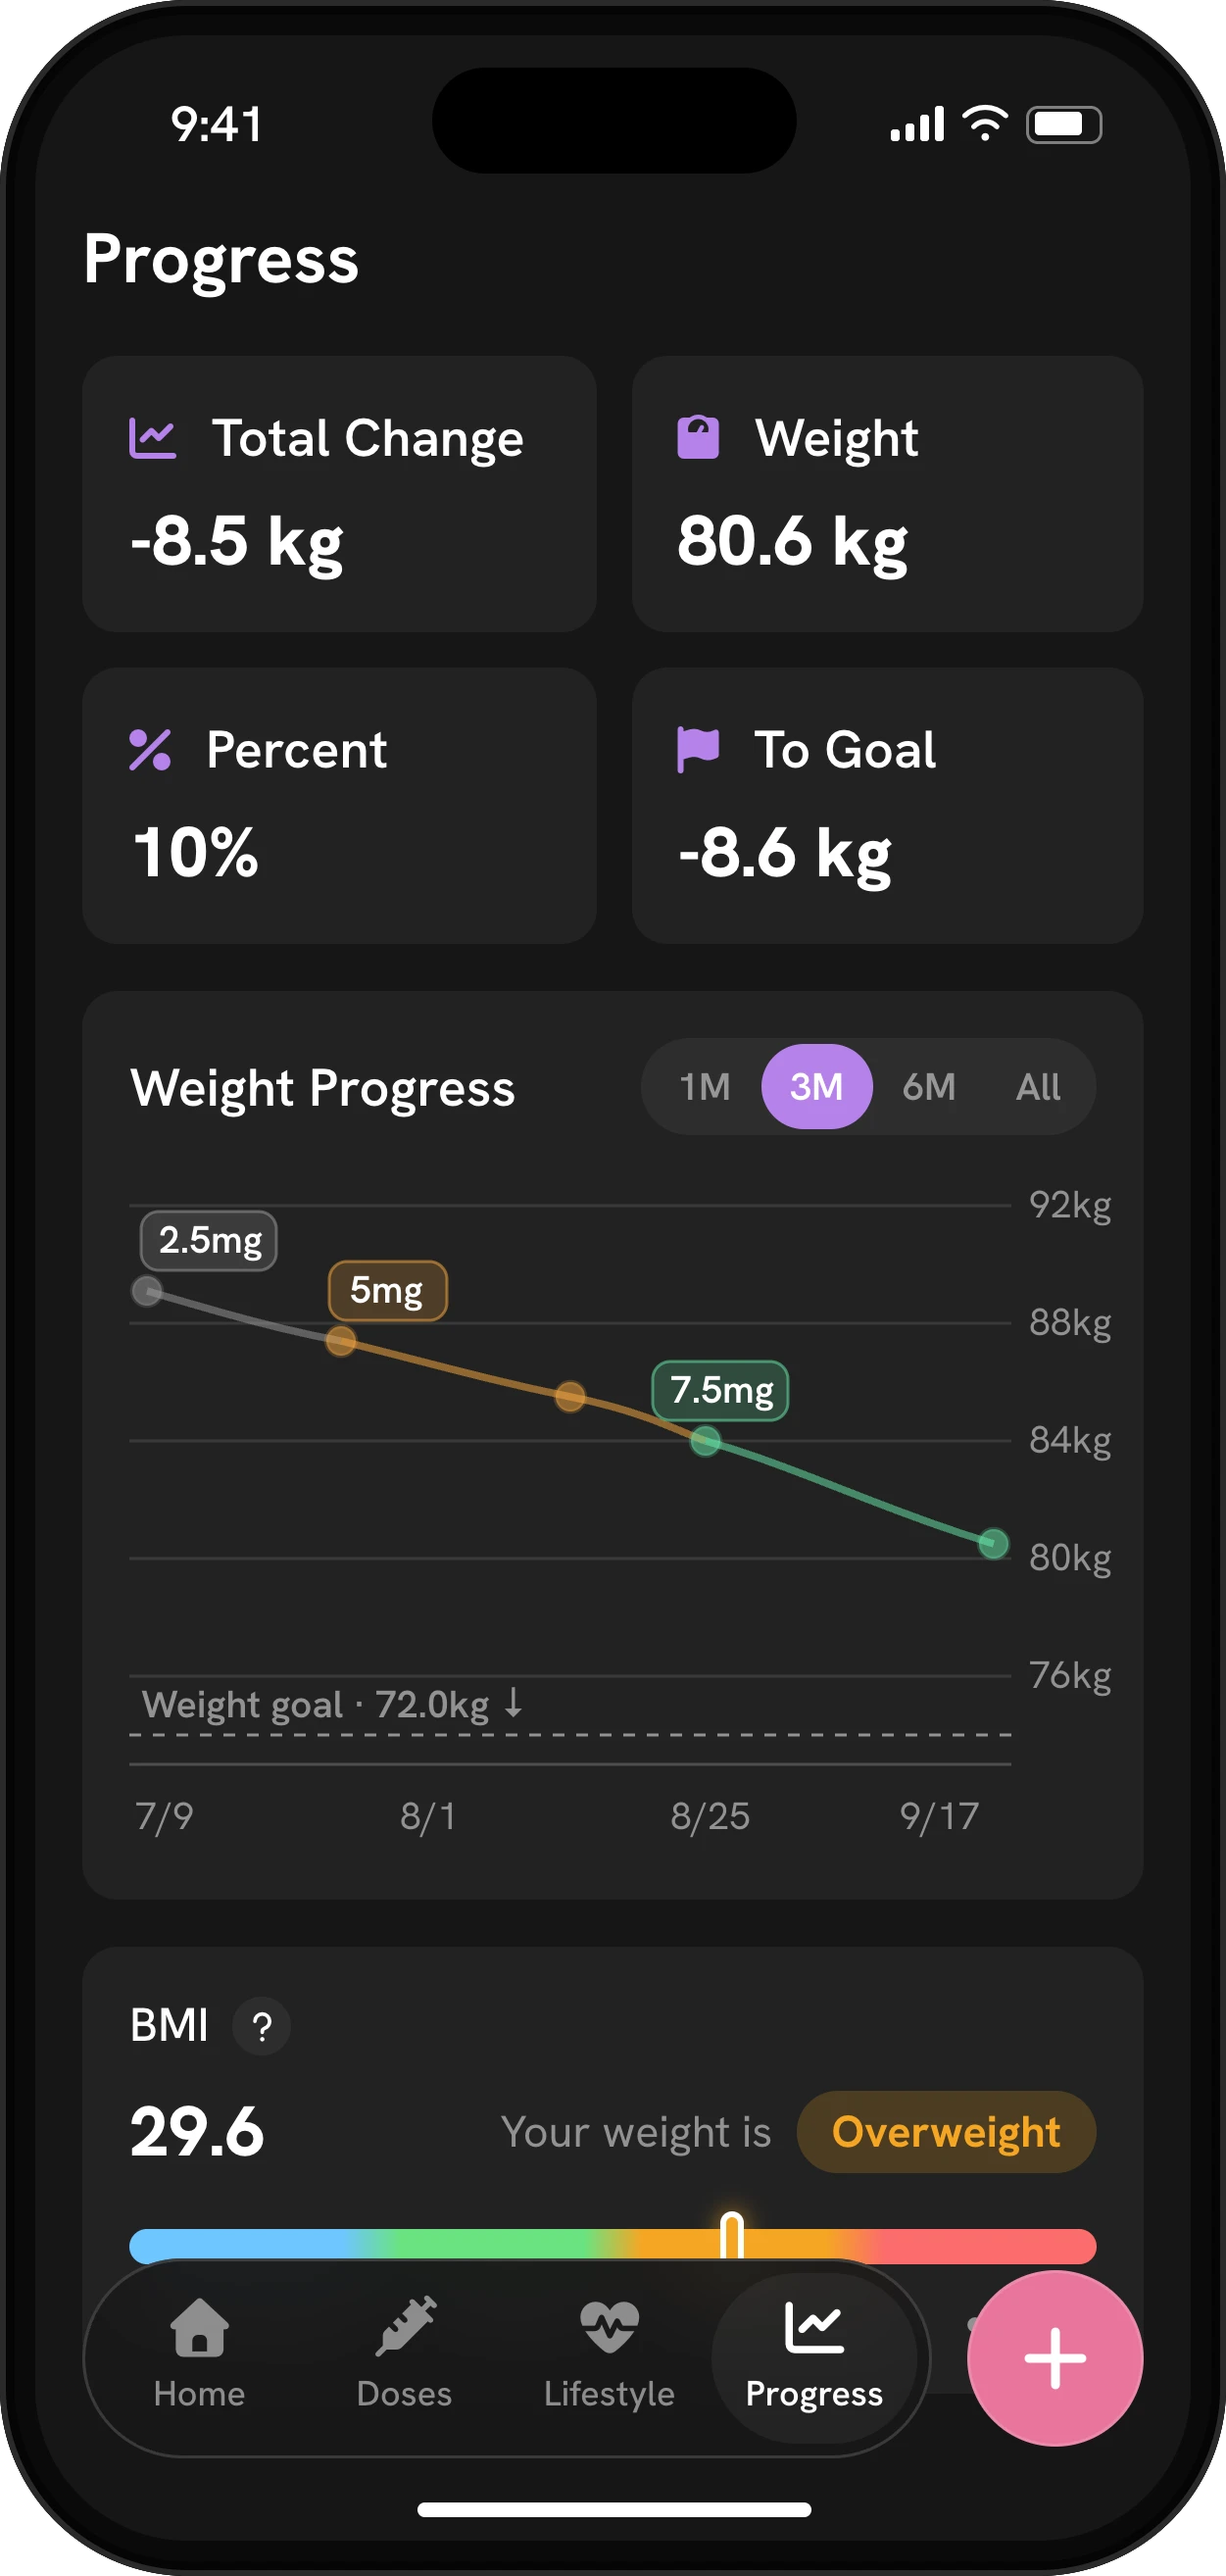
A normal weight app draws one line. On a GLP-1, that line hides the most useful information: which dose you were on. Most people start low and step up every four weeks or so, and the weight curve tends to change shape with those steps. A slow first month on the starting dose is common and expected; the starting dose of Wegovy or Zepbound is there to help your body get used to the medicine, not to drive weight loss.
So Mingo colors the line by dose. Each stretch between shots of the same dose takes that dose’s color, and your shots are marked on the chart. When you look back, you can see where the loss sped up, where it flattened, and whether that matched a dose change, a missed shot or a holiday.
What the trials say to expect
The two big trials give a sense of scale. In STEP 1, adults without diabetes on Wegovy 2.4 mg lost 14.9% of their body weight on average after 68 weeks, against 2.4% on placebo. In SURMOUNT-1, people on tirzepatide (Zepbound and Mounjaro) lost 15.0%, 19.5% and 20.9% after 72 weeks on 5, 10 and 15 mg, against 3.1% on placebo. Those are averages over more than a year. Plenty of people lost more, and plenty lost less.
Because trials report loss as a percentage, Mingo shows your total change in both weight and percent. If you’d like to compare yourself with those numbers, the weight loss percentage calculator does the math, and the GLP-1 weight loss calculator shows the trial averages week by week.
BMI, goal and pace
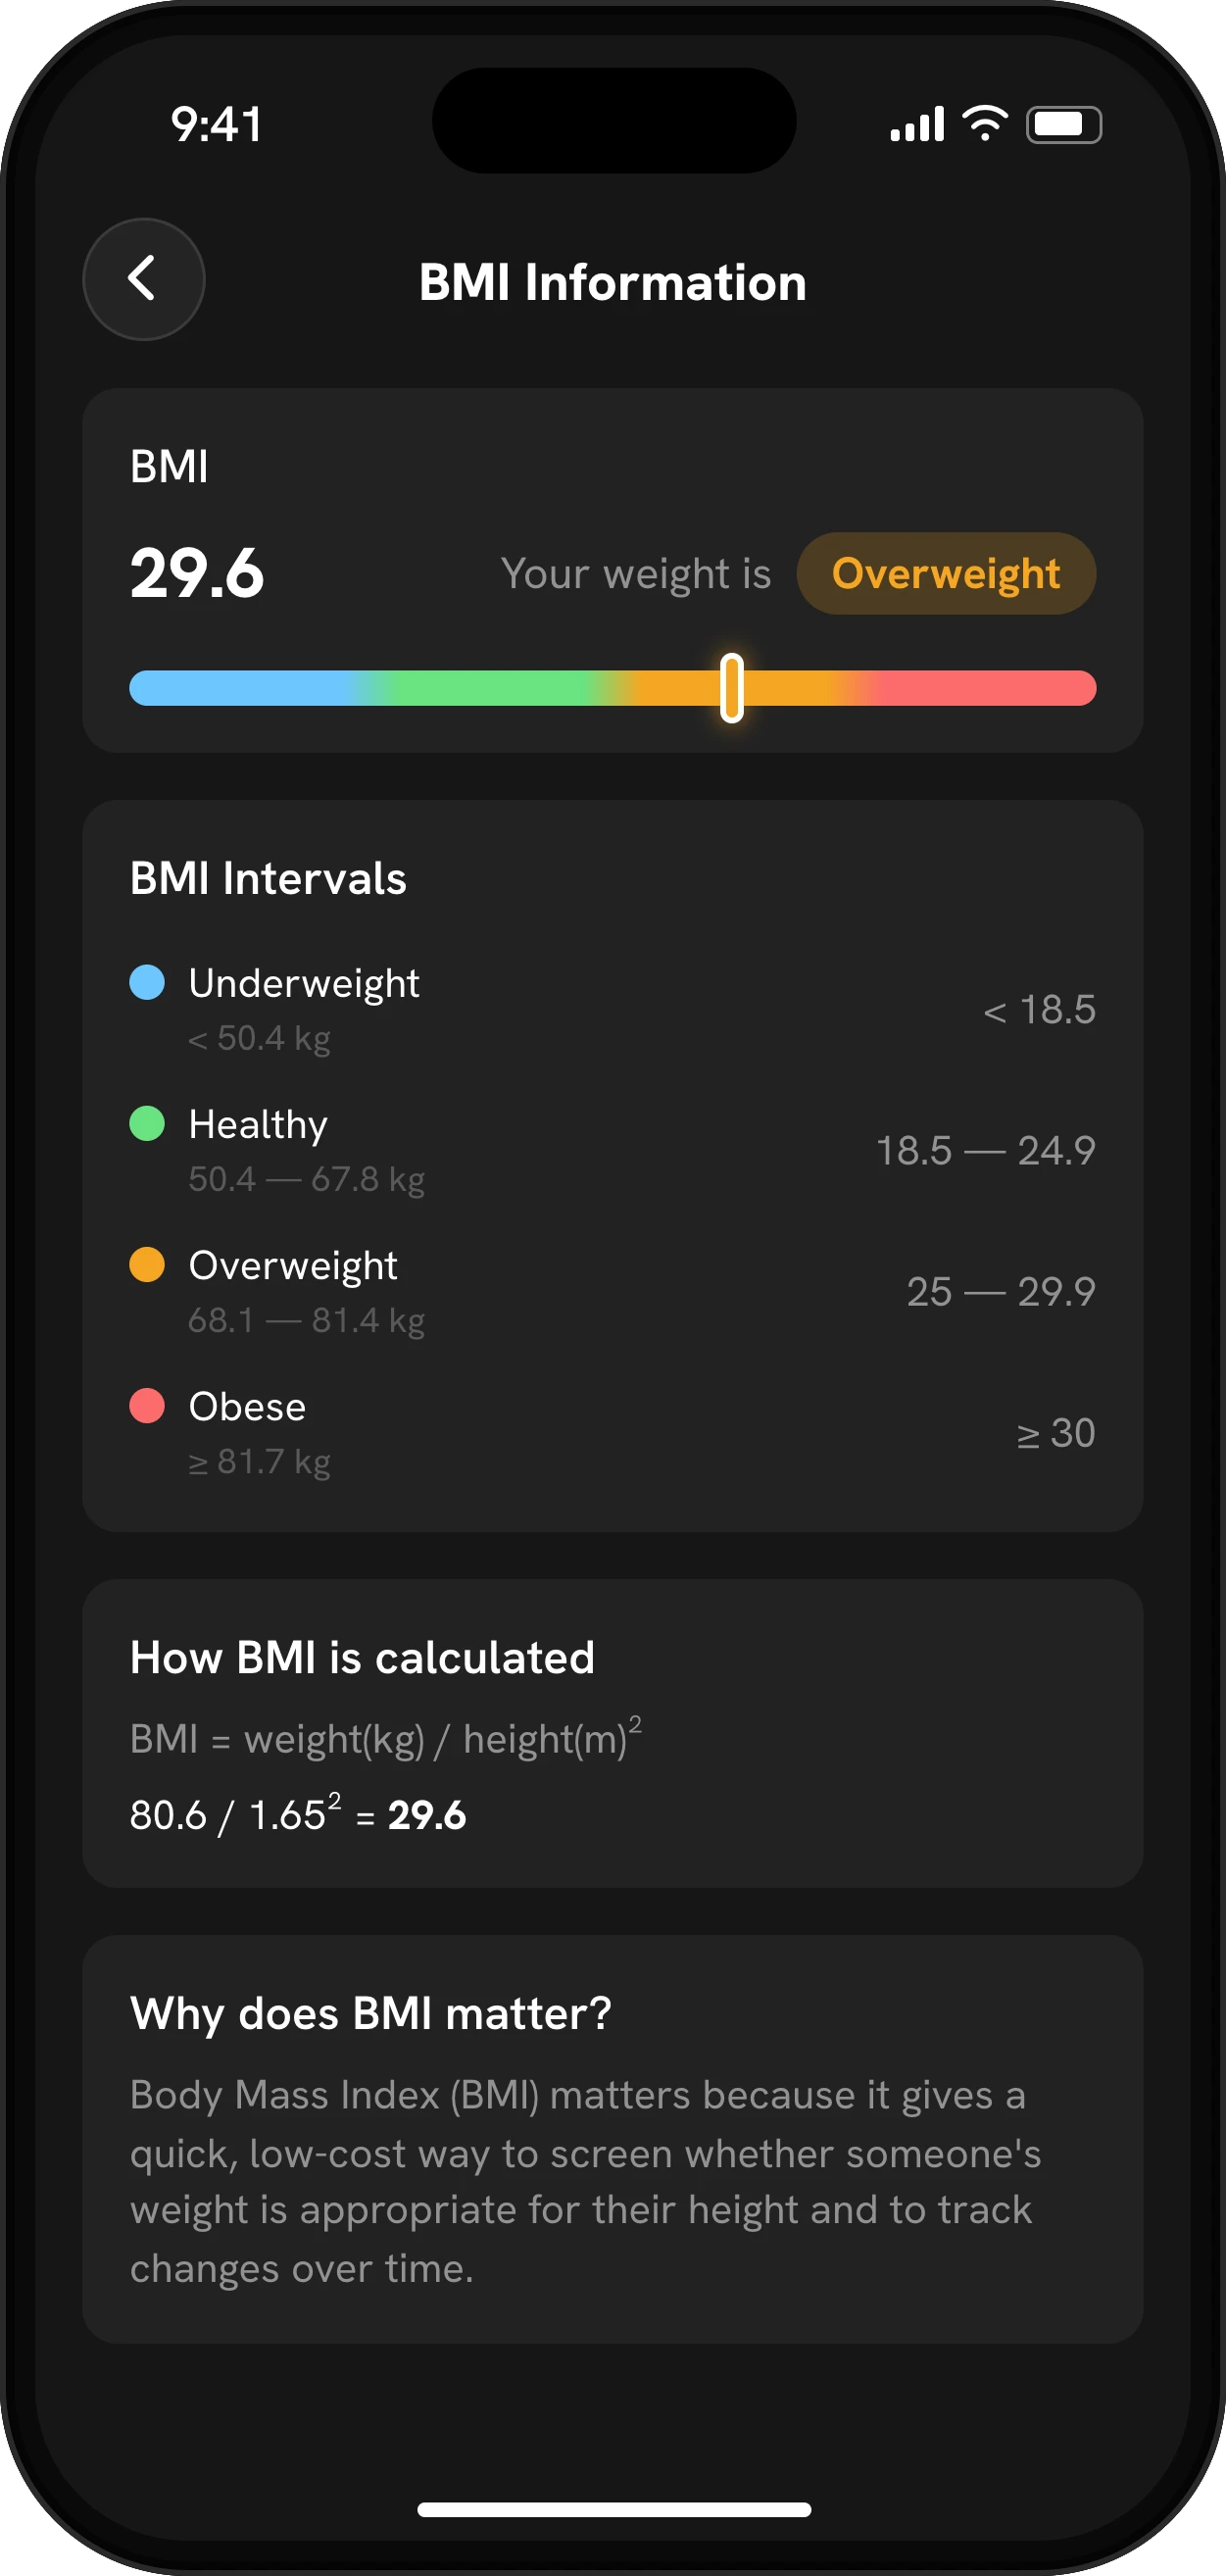
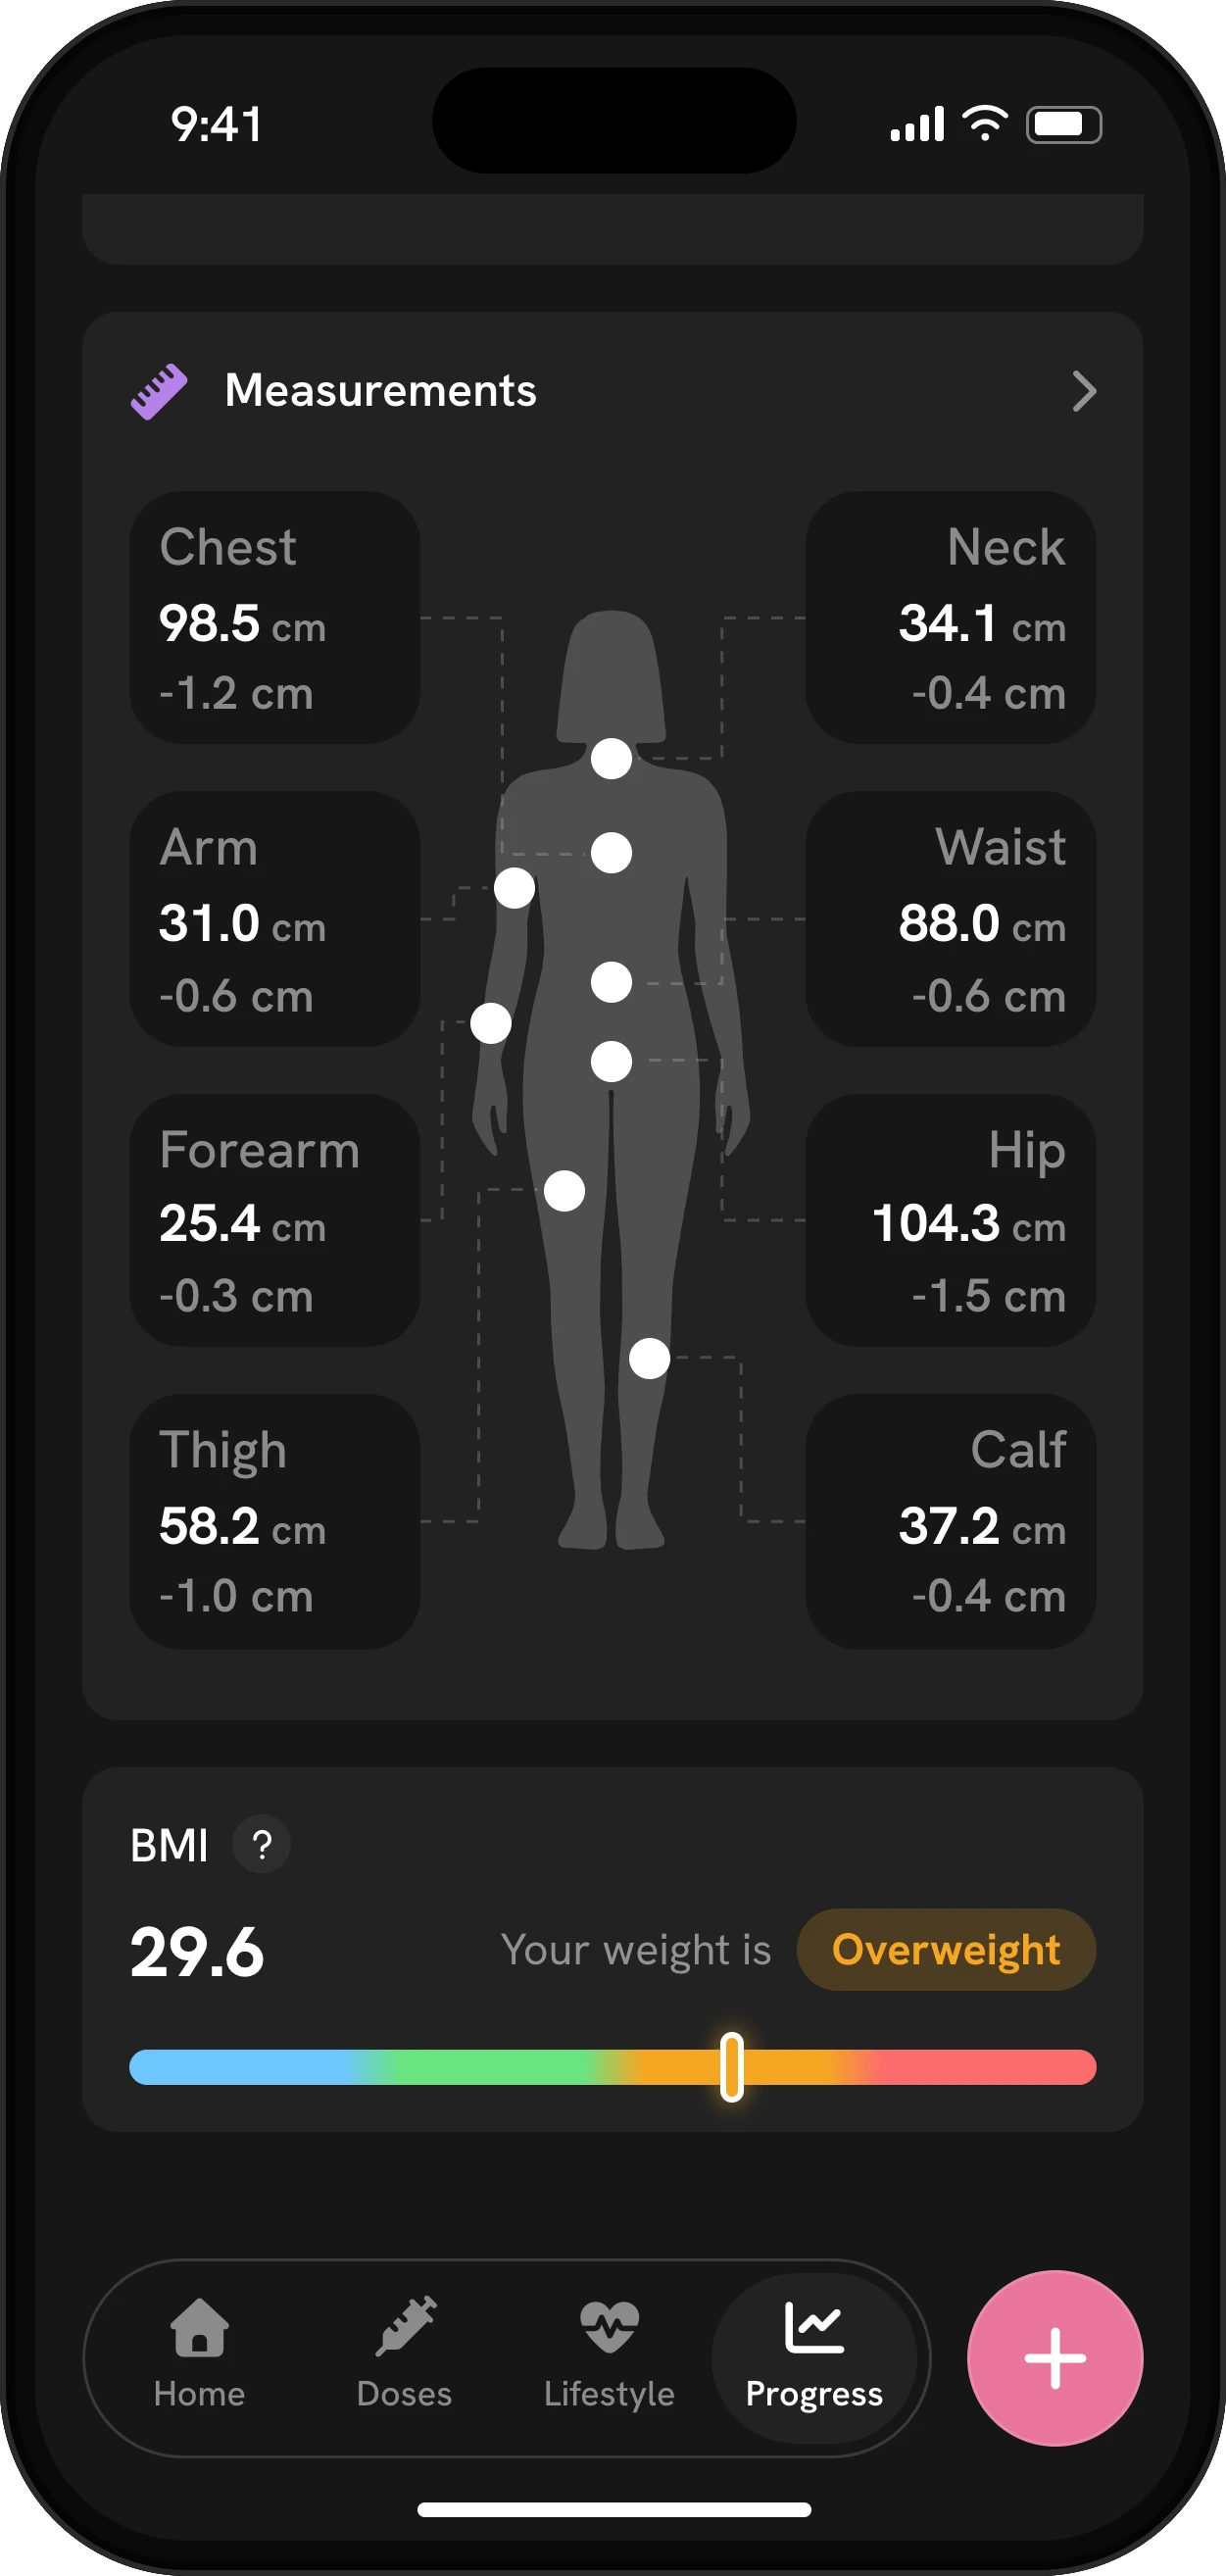
Mingo works out your BMI from your height and current weight and shows the category it falls into, using the standard adult cut-offs: under 18.5 underweight, 18.5 to 24.9 healthy, 25 to 29.9 overweight, and 30 or more obese. BMI is a screening number. It doesn’t tell muscle from fat, which is one reason Mingo also tracks body measurements and body composition. You can check any weight with the BMI calculator.
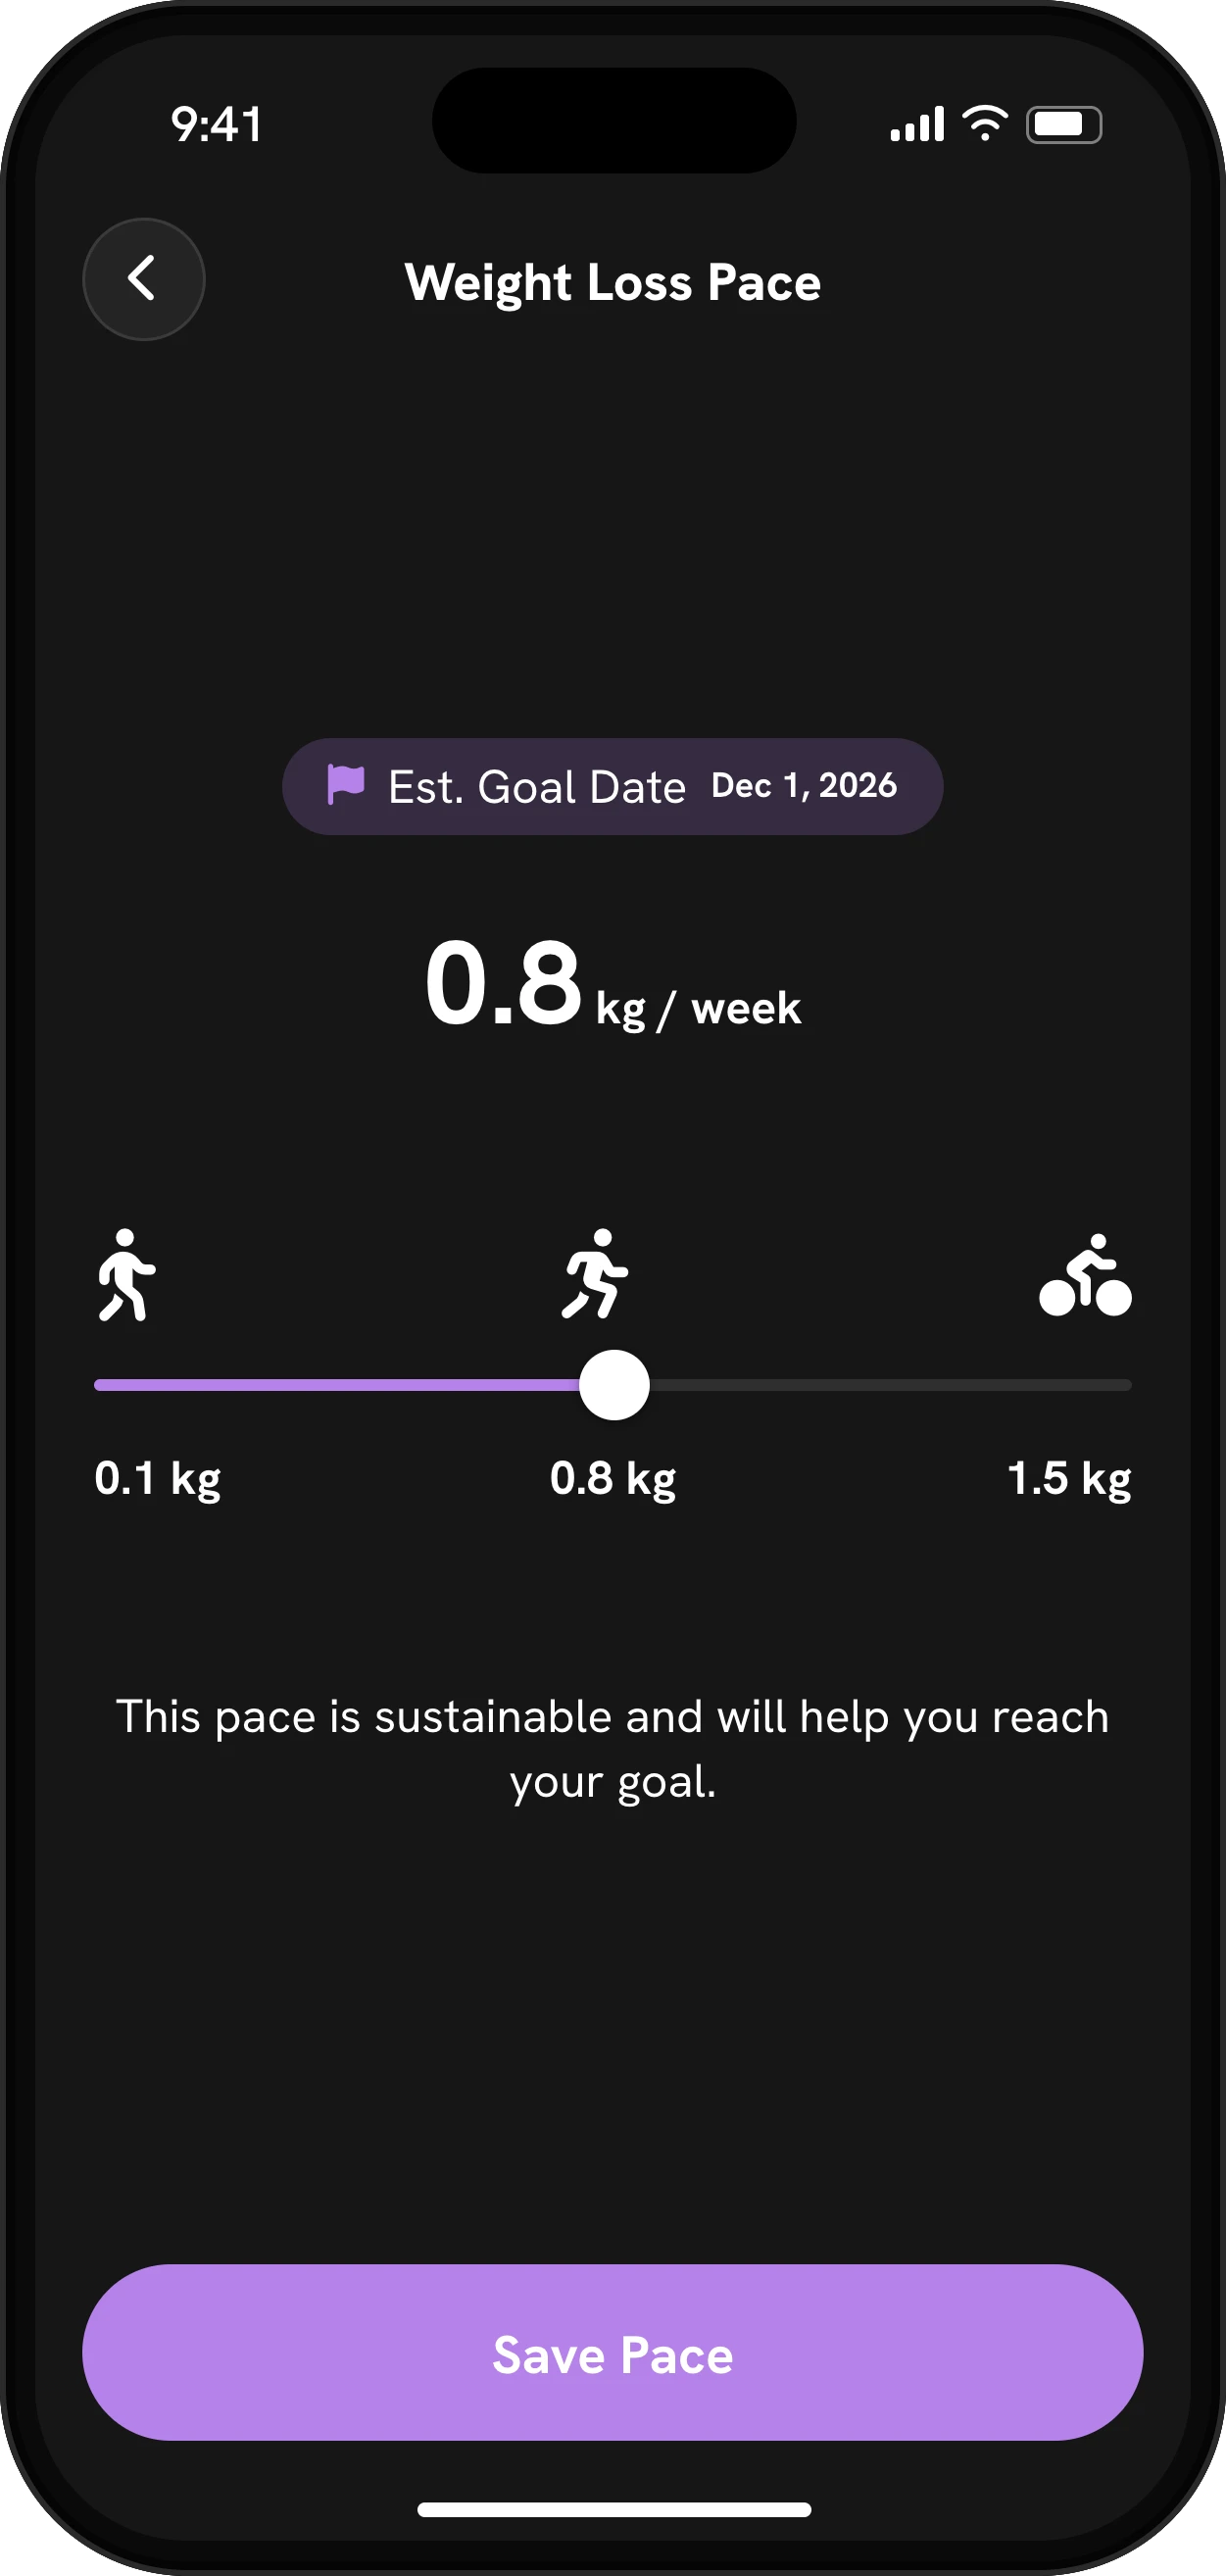
Set a goal weight and Mingo draws it on the chart as a dashed line. Then pick a weekly pace: Mingo describes it as slow, moderate or ambitious and estimates the date you’d reach your goal at that pace. Treat that date as a plan, not a promise. It assumes a steady pace, and real loss usually slows: in both trials above, the average curve flattened toward the end. Agree the pace with your doctor and check the date against your real line now and then.
What a good weight log records
Printable trackers and spreadsheets usually have the same columns: date, weight, change since last time, total change, and a goal. Some add measurements and a notes line. Those are the right basics, and Mingo keeps all of them, with the math done for you. What it adds for a GLP-1 is the dose you were on for every weigh-in, so a stall or a drop has context. A paper chart can’t tell you that a plateau began the week you missed a shot.
Logging that fits your routine
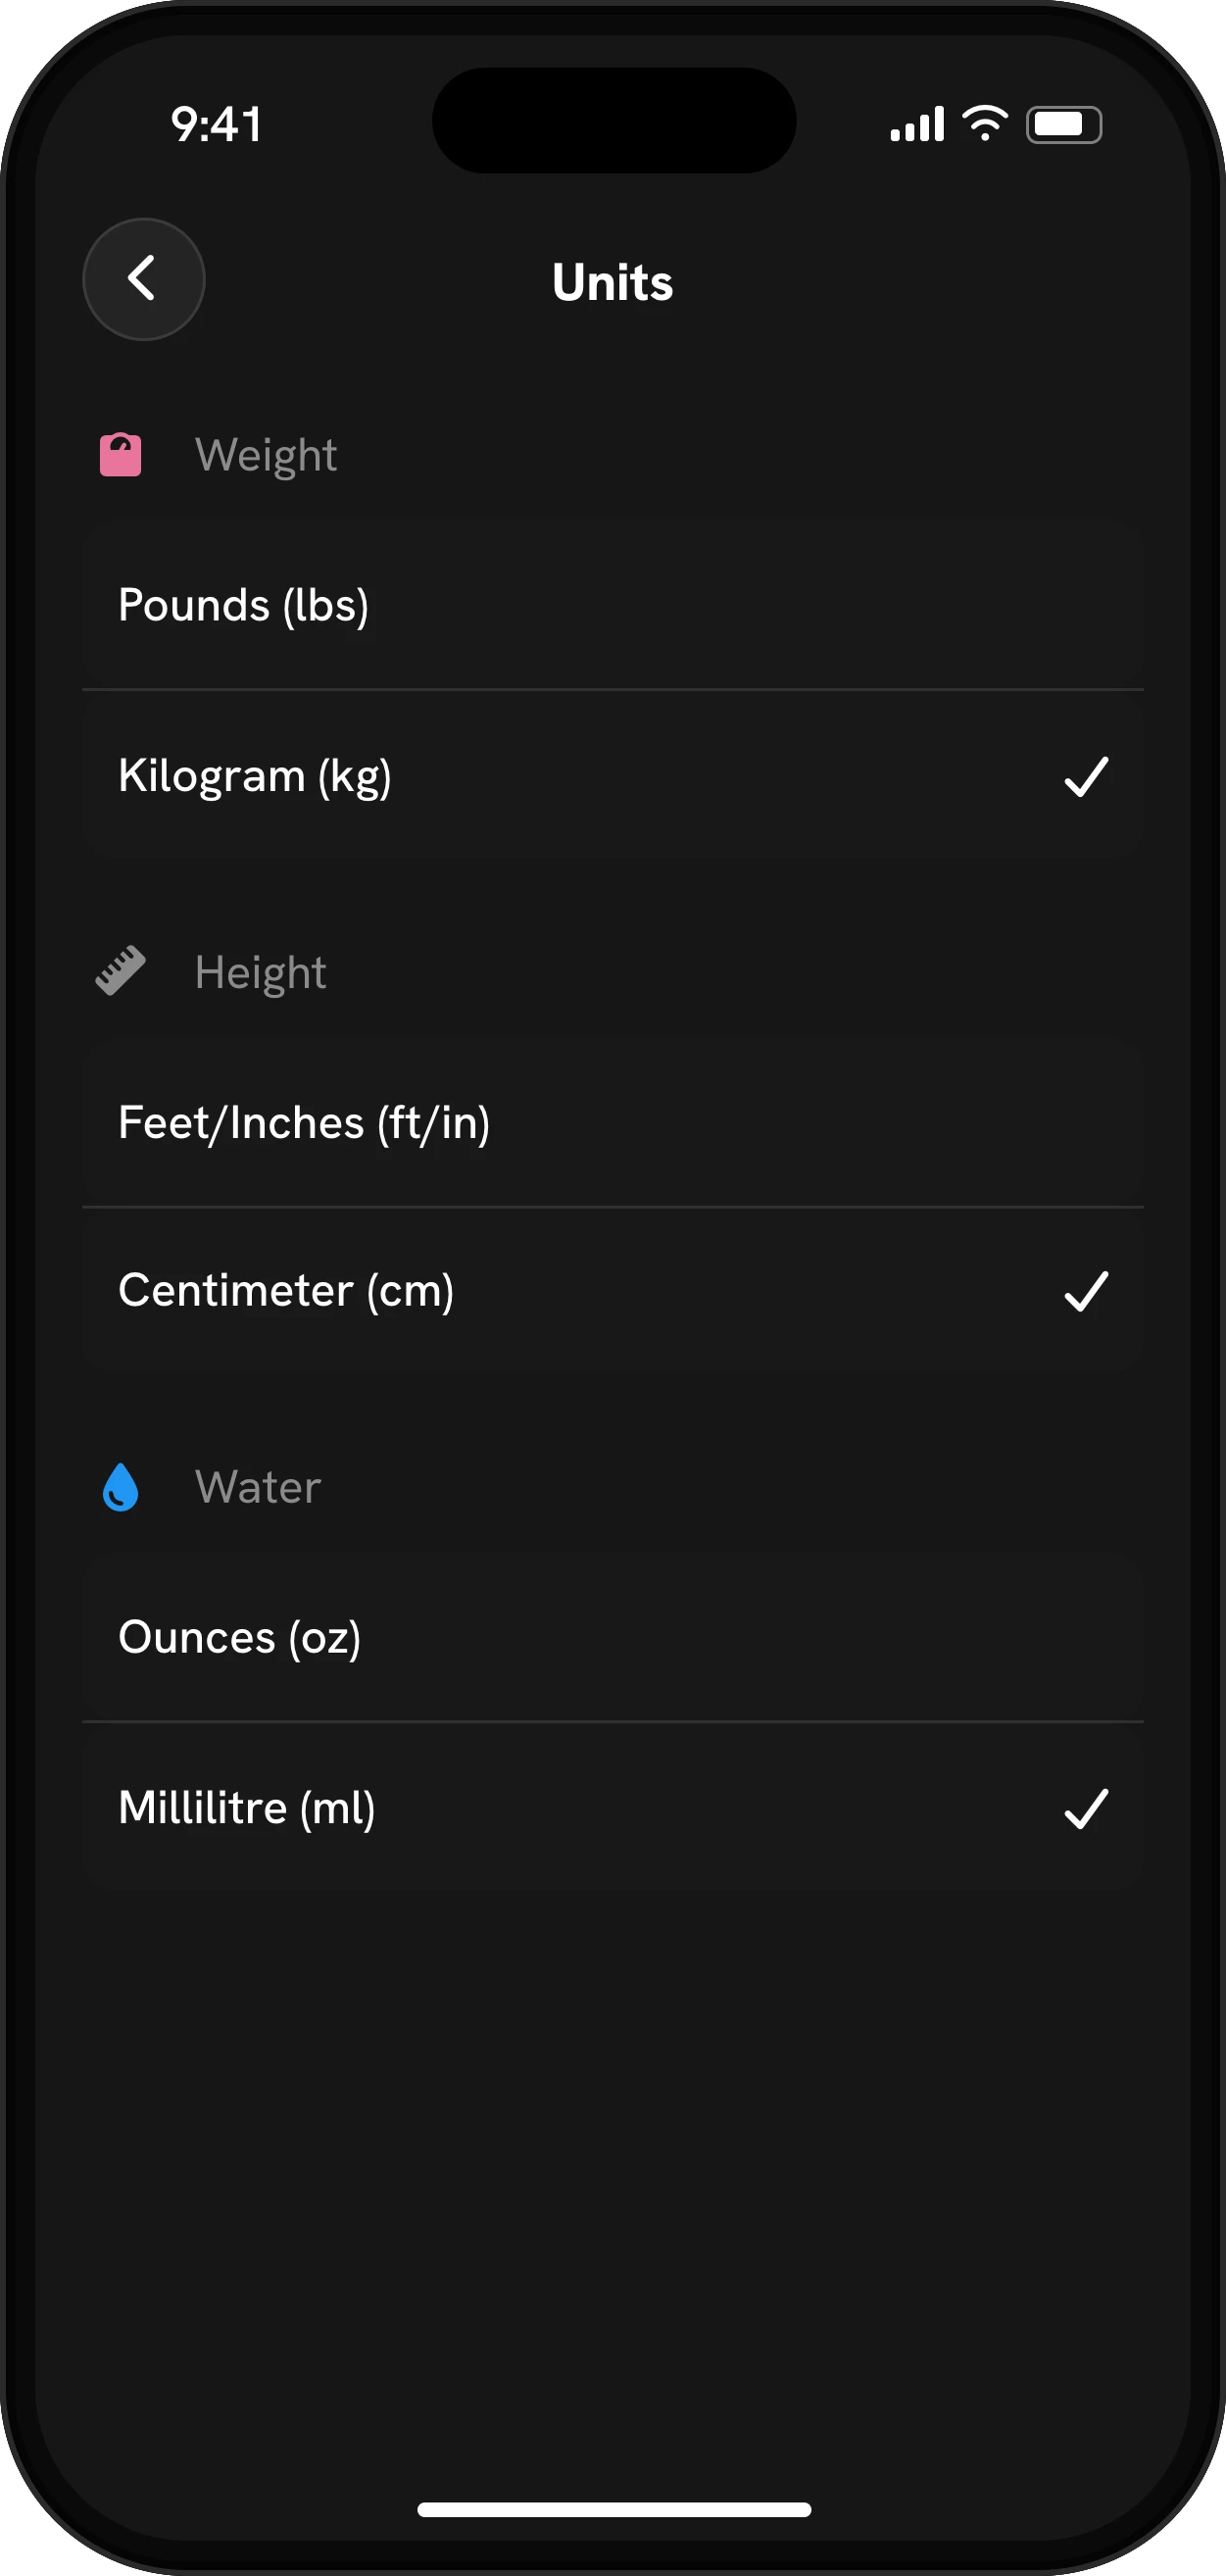
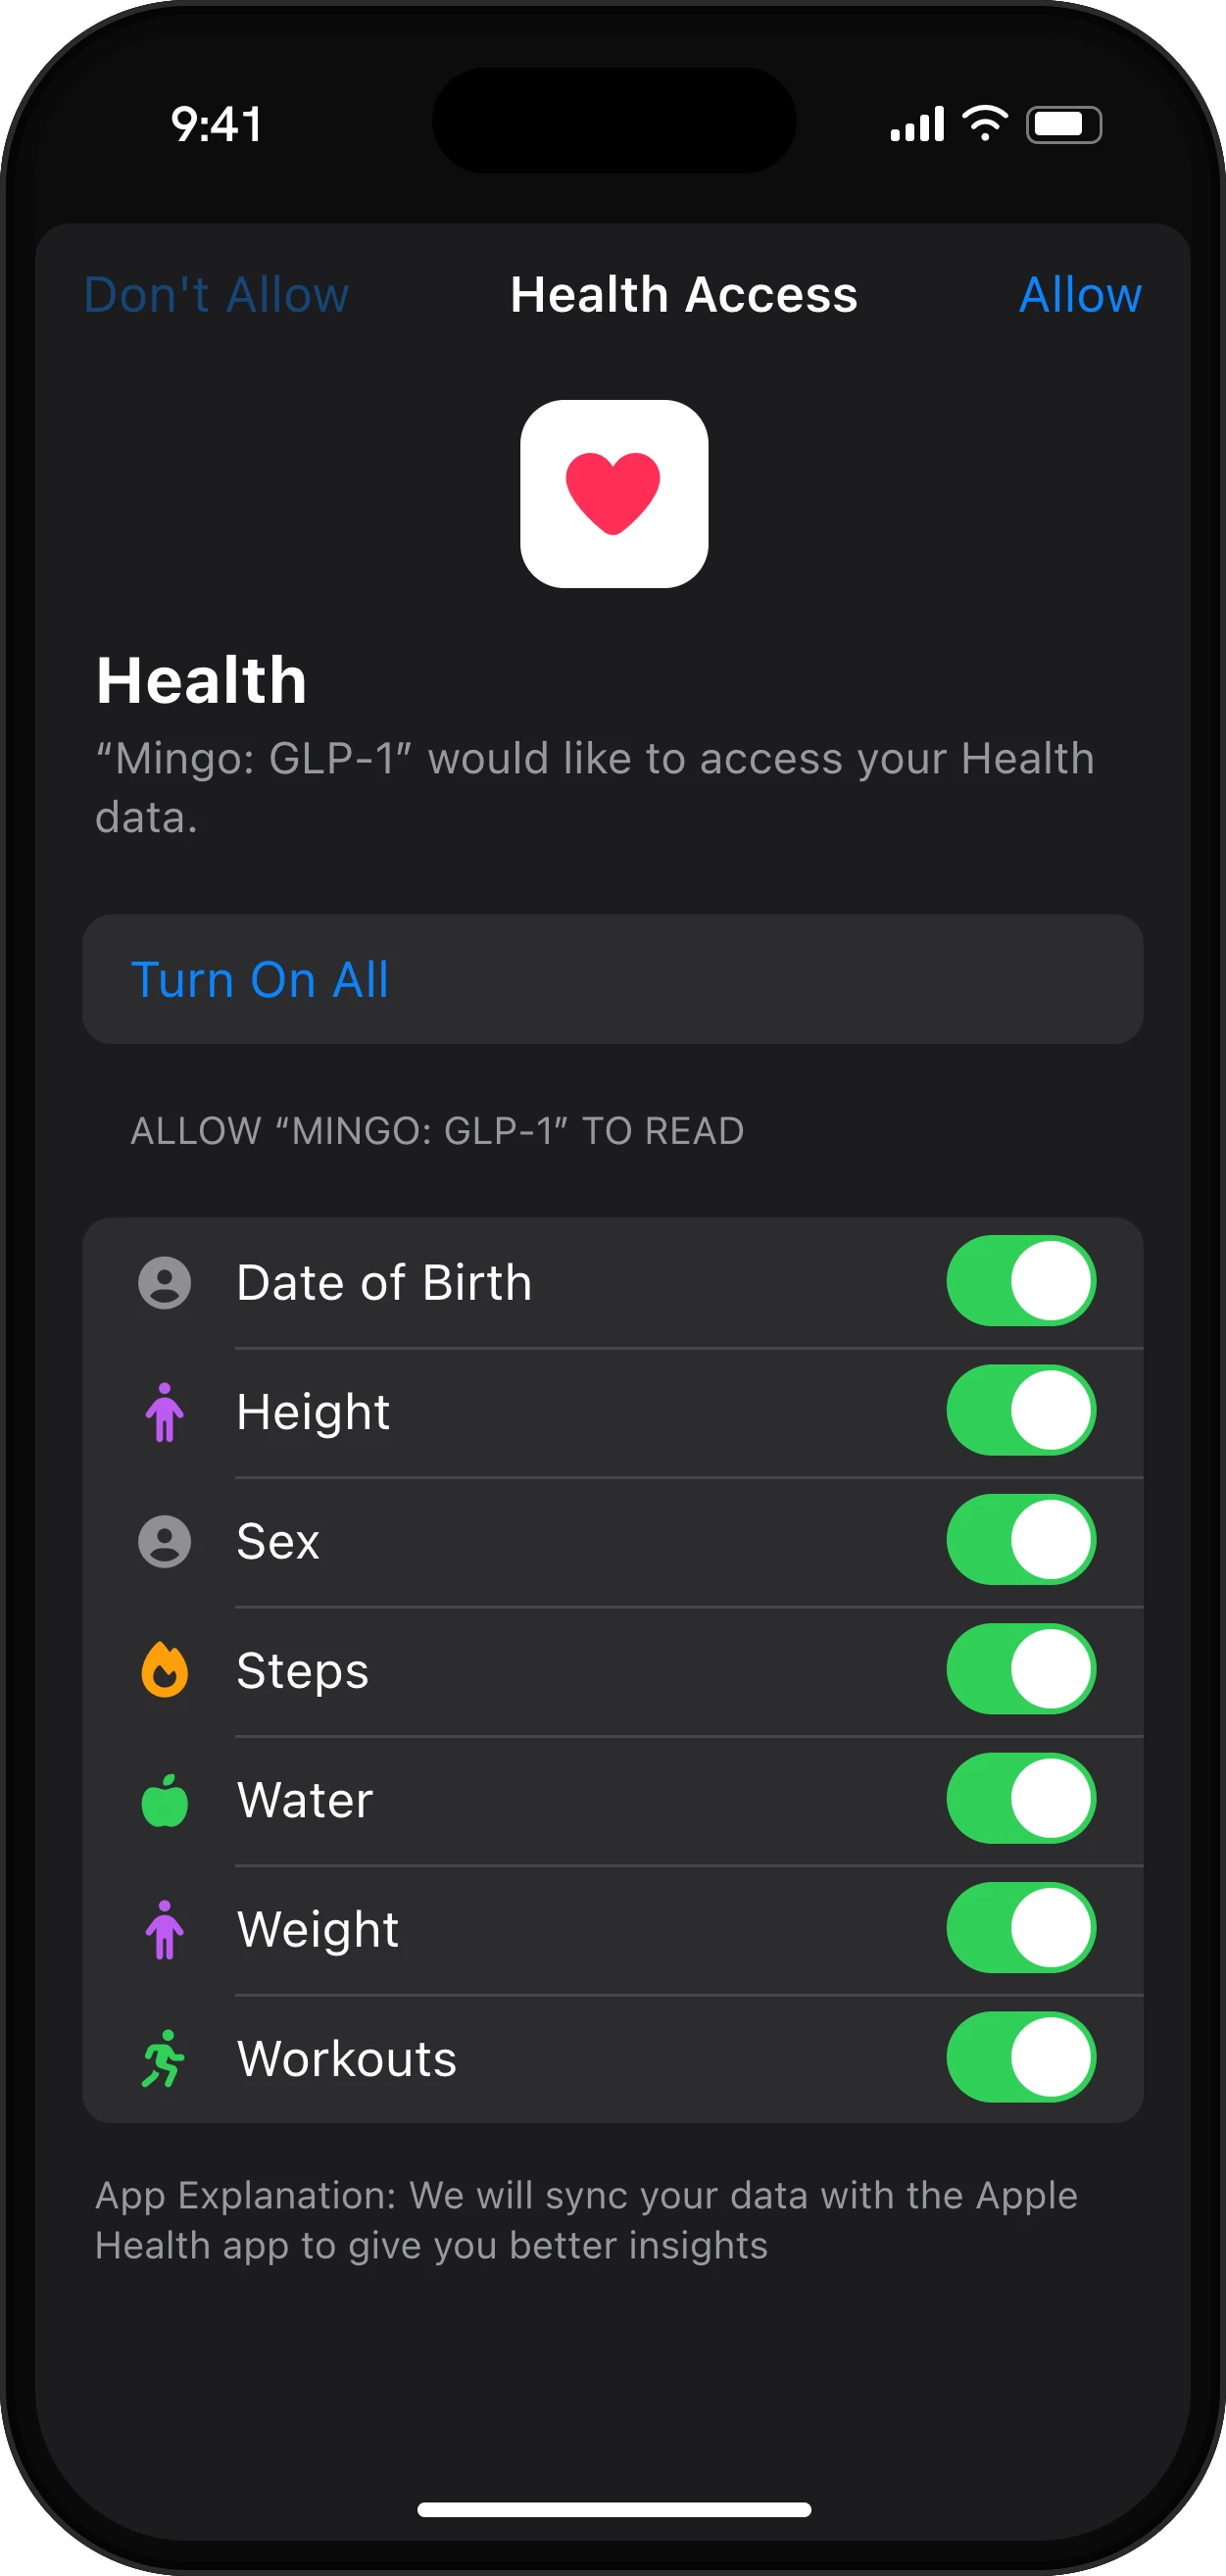
You can log weight by hand in pounds or kilograms, or let it come in. If you weigh yourself on a smart scale that writes to Apple Health or Health Connect, connect Mingo and your weigh-ins appear in your history. The Apple Health sync page lists everything Mingo reads.
Daily weight moves with water, salt, your cycle and what you ate yesterday. Weighing at the same time of day, under the same conditions, makes the trend easier to read. Look at the chart over weeks, not at a single morning.
When the scale stalls
Plateaus happen to almost everyone. Before deciding something is wrong, look at the rest of your log. Did your waist or hips still go down? Do your progress photos show a change the scale doesn’t? Have your protein and water dropped off? If the stall is real and lasting, bring the chart to your prescriber: a weight line colored by dose is exactly what they need to see.
For your appointment
The doctor report puts your weight trajectory next to your doses and estimated medication level, with your start and current weight, total change, BMI and average rate of loss for the period you choose.
Mingo is a tracker, not medical advice. Your prescriber decides your dose and your goals.


